Report: Velocity
Description
 |
 |
Activities using this report
|
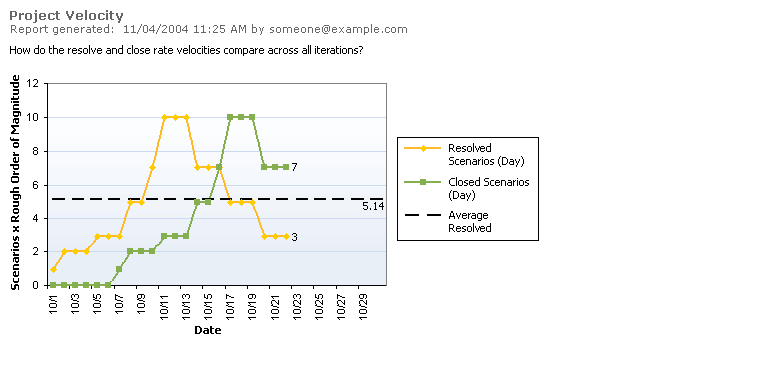
How quickly is the team completing work? Velocity is one of the key elements for estimation. It shows how quickly the team is actually completing planned work, and how much the rate varies from day-to-day, or iteration-to-iteration. Use this data to plan the next iteration, in conjunction with the quality measures. Similar to the remaining work chart, this is most useful when looking at days within an iteration or iterations within a project.
Healthy Example

The velocity report can be used to look at the daily velocity for any type of work item including bugs.
Data Series
| Line |
Description |
|
Resolved Work Items |
- This line shows the count of work items resolved on each day.
|
|
Closed Work Items |
- This line shows the count of work items closed on each day.
|
|
Bugs Found per Scenarios Resolved |
- This line divides the sums of bugs found by scenarios resolved. Cumulative bugs found and scenarios resolved is a quality indicator that may warn that scenarios are being resolved (i.e. sent into testing) prematurely. This quality indicator should stay low. If it goes up, more time is needed to find and fix bugs.
|
Unhealthy Examples

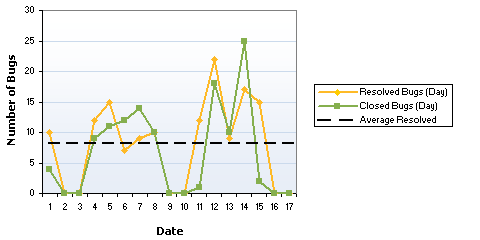
This velocity report shows large variation in the resolve and close rates with no clear pattern over the course of the iteration. This variation may be a sign of poor planning or problems in keeping the team dedicated to this project.


