Report: Unplanned Work
Description
 |
 |
Activities using this report
|
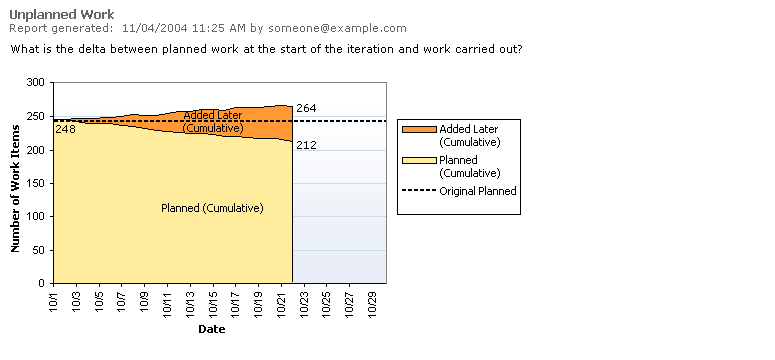
How much unplanned work is there? This graph distinguishes the total work from the remaining work and charts it into the planned and unplanned. Very few projects know all of the work to be done ahead of time, even within the iteration. This may be perfectly acceptable, if you schedule a sufficient buffer for handling the load of unplanned work (for example, bugs). On the other hand, it may be a real problem if you have not scheduled the capacity and are forced to cut back on the planned work.
Healthy Example

The unplanned work report is not general used on agile projects but can be a nice reflection on how much change actually occurred.
Data Series
| Line |
Description |
|
Chart Height |
- The top line of this graph matches the top line of the Remaining Work graph. The total height is the total amount of work to be done in the iteration.
|
|
Added Later |
- The areas then divide the work into the planned and unplanned segments, where "unplanned" means unscheduled as of the beginning of the iteration.
|
|
Interpretation |
- For monitoring, use this graph to determine the extent to which unplanned work is forcing you to cut into planned work. For estimation, use this to determine the amount of schedule buffer to allow for unplanned work in future iterations.
|
Unhealthy Examples

This unplanned work report, filtered for scenarios, shows a significant climb in the newly added area. This is an example of “scope creep,” the usual term for the late piling on of requirements, or the inability of the project manager to keep the current iteration focused on its initial target.


