 |
Report: Quality Indicators
Description
 |
 |
Activities using this report
|
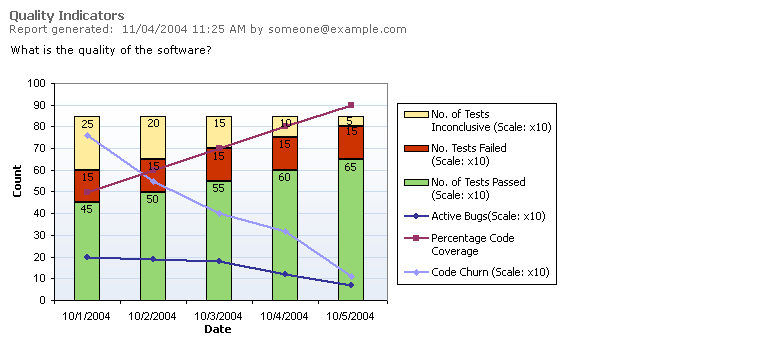
What is the quality of the software? Ideally, test rates, bugs, and code churn would all produce the same picture, but often they do not. When you find a discrepancy, you need to examine in further detail the appropriate build and data series. This graph combines the test results, code coverage from testing, code churn, and bugs, to help you see many perspectives at once.
Healthy Example

Code coverage and test pass rates are high and climbing over time. Code churn, active bugs, inconclusive tests, and failed tests are all low and falling. Data Series
| Line |
Description |
|
Bars |
- The height of the bar shows you how many tests have been run, and of those, how many have returned Pass, Fail, and Inconclusive results.
|
|
Code Coverage |
- The first series of points is the Code Coverage attained by those tests (specifically, the ones run with code coverage enabled). Ordinarily, as more tests are run, more code should be covered. On the other hand, if test execution and test pass rates rise without a corresponding increase in code coverage, then it may indicate that the incremental tests are redundant.
|
|
Code Churn |
- The second series of points is Code Churn; i.e. the number of lines added and modified in the code under test. High churn obviously indicates a large amount of change and the corresponding risk that bugs will be introduced as the side effect of the changes. In a perfectly refactored project, you can see code churn with no change in code coverage or test pass rates. Otherwise, high code churn may indicate falling coverage and the need to rewrite tests.
|
|
Active Bugs |
- The third series is the active bug count. Clearly, there should be a correlation between the number of active bugs and the number of test failures. If the active bug count is rising and your tests are not showing corresponding failures, then your tests are probably not testing the same functionality that the bugs are reporting. Similarly, if active bug count is falling and test pass rates are not increasing, then you may be at risk for a rising reactivation rate.
|
Unhealthy Examples

This quality indicators report shows a decrease in code coverage and an increase in code churn for Build 32. This is a clear warning that new code is being checked in without corresponding unit tests to cover it. 
This quality indicators report shows a low rate of tests being run. This would probably mean that too little testing is occurring. This could be due to lack of resources, or it could be that testers are doing something else, such as writing test automation rather than testing the current functionality. In either case, resource balancing may be warranted. 
This quality indicators report shows a high test pass rate, but still a large incoming bug rate. Even worse, customers and beta users may be reporting lots of bugs that testing is missing. This can occur for several reasons. The tests may be too gentle for this stage of the product. In early iterations, gentle tests are good, but as the product matures, tests should exercise broader scenarios and integrations. Tests might be stale or be testing the wrong functionality. Finally, it may be time to switch test techniques. 
This quality indicators report shows a high rate of code churn and a low rate of code coverage from testing. Yet test pass rates remain high. This indicates that the tests being run are not exercising the new code. 
This quality indicators report shows that many tests are being run, with reasonable code coverage, but the tests are failing. This is probably an indicator of loose development practices, although in early iterations, it might be an indicator that the tests are too harsh for this stage of the product. |
 |


