Report: Bug Rates
Description
 |
 |
Activities using this report
|
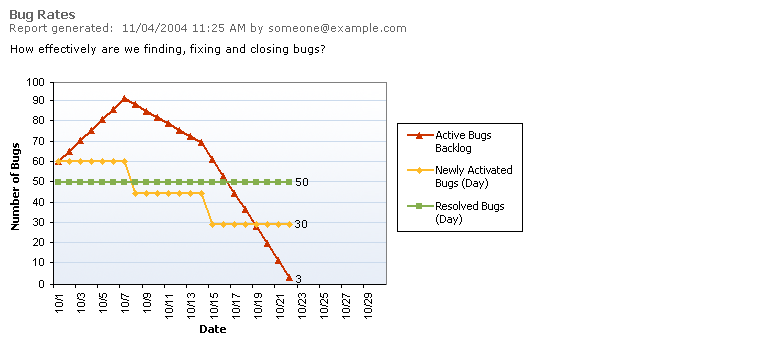
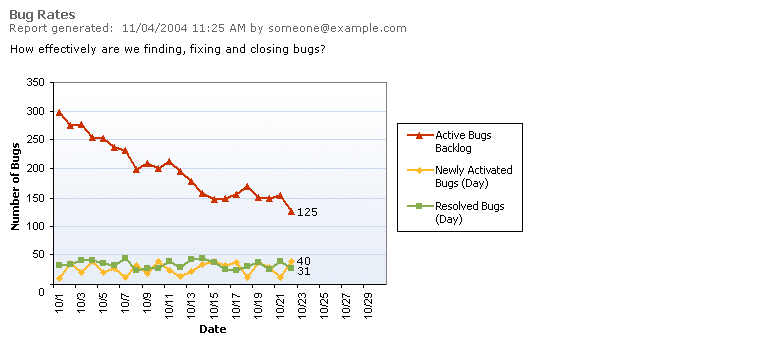
How effectively are bugs being found, fixed, and closed? Bug rates are best interpreted relative to all of the current team project activities and the other metrics on the Quality Indicators graph. For example, a high find-rate may be a sign of poorly written code, newly integrated code, or effective testing, or exceptional events such as a bug bash. On the other hand, a low find rate may mean high quality product or ineffective testing. Use code coverage, code churn, and test rates to help you assess the meaning.
Healthy Example

Second image
Data Series
| Line |
Description |
|
Active Bugs |
- The total active bug count (sometimes called "bug debt") as of the date on the x axis.
|
|
Newly Active Bugs |
- How many new bugs are found on the date.
|
|
Resolved Bugs |
- How many bugs are resolved on the date.
|
Unhealthy Examples

The declining bug rates indicates a healthy transition to release.

This bug rates report shows a constant find rate of bugs over time. This can occur for several reasons. The tests may be too gentle for this stage of the product. In early iterations, gentle tests are good, but as the product matures, tests should exercise broader scenarios and integrations. Tests might be stale or be testing the wrong functionality. Finally, it may be time to switch test techniques.


